
 On The Road
by: Bill Oetinger 5/1/2008
Profiles in Confusion
This is a follow-up to last month’s column, Altitude Sickness. It probably would work better if you have already read the previous piece. If you haven’t read it yet, now’s the time to do so...
In that column, I explored the topic of altimeters, and the business of recording elevation gain on our climbs. After a more-or-less superficial introduction, I turned things over to my friend Lou Salz, a smart engineer with a keen interest in logging bike ride data. Lou examined the subject in more depth and detail and with more expertise than I could possibly have managed...thank you, Lou. He went on at such length that, when he was finished, I felt the column had gone on as long as it needed to. But there were still a few related items I wanted to kick around. So here we are, a month later, barking up the same tree again.
One of the items under discussion was the question of the relative accuracy of different altimeters. I’ve only ever used the Avocet and the Cateye, pretty much the first two readily available bike altimeters. The conventional wisdom has always been that the Avocet reads a little low and the Cateye a little high. As far as I know, that has always been based on subjective observation and anecdote, rather than any hard science. Lou went into detail as to what the problems are with barometric readings and what Avocet at least had done to address that. (Read last month’s column.) He claims that the Avocet is more accurate than the Cateye.
While I have the greatest respect for Lou’s analysis, I have to say my own seat-of-the-pants, anecdotal observation does not entirely jibe with his conclusion. Take Avocet’s algorithm for dealing with the anomalous hysteresis of mobile barometers, with its 30-foot throwaway factor. We have a loop of roads up in Dry Creek and Alexander Valleys that was used for the circuit race at both the Master’s National Championships and a pro race in 1996. The loop has a couple of larger climbs and a multitude of rollers...a washboard’s worth of rollers. I did that loop with the Avocet, and I watched the absolute altitude climb in 25 and 30-foot increments on each of those rollers. But if the rollers did not exceed 30 feet--and most of them did not--those feet were not counted in the total elevation gain for the loop. I kept track of all those lost chunks all the way around the loop. The classic argument in favor of this 30-foot discard logic is that these are little more than freeway overpasses. Well, hey, over the course of this loop of several miles, the altimeter threw out quite a few of those rollers, and if you added up the total over the course of a 15 or 20-lap race, the ultimate inaccuracy was substantial. I’m sorry I no longer have the figures available from my little experiment, but I do recall the error was significant.
You might say, well what difference do the numbers make anyway? You have to climb the hills regardless. I agree. (And, for the record, I hardly ever do keep a record of elevation gain anymore.) But if you are going to have and use a measuring tool, it ought to be accurate, and in my estimation, the protocol built into the Avocet resulted in a problem worse than the problem it was designed to fix. The cure was worse than the disease.
It’s almost academic at this point. I don’t think Avocet even makes that cyclometer anymore. And they were so prone to breakdowns that most of them have fallen out of use years ago; their former owners have moved on. I did see one in use on a ride last weekend though. My pal Mike DeMicco--another engineer; a rocket scientist, no less--is still using one. Remember that not-too-hilly April century I mentioned last month? He did it with me. He recorded 6200’ with his Avocet and I logged 6800’ with my Cateye. So we split the difference and called it 6500’ for the ride.
The Cateye, in my experience, is always going to read higher than the Avocet, but does that mean it’s too high? I assume it must be a little on the high side, and on the rare occasions when I do make a note of my elevation gain on big, hilly rides, I always round down a bit from whatever the Cateye tells me. However, Lou and I did a rather hilly one-week tour together a couple of years ago, and we compared our elevation figures after each ride. (He was using whatever the state-of-the-art GPS unit was at that time.) We found our data to be very close each day; well within a small, acceptable margin of error. Admittedly, seven stages and 14 data points do not constitute a vast sampling, but it was noteworthy as far as it went.
For more comparisons of the relative readings of altimeters, you might want to check out a survey that has been put together by those busy beavers at the California Triple Crown. If you go to their site and hunt through the table of contents, you’ll find a link to an Altimeter Study. Click on that and you will eventually generate an Excel spreadsheet with enough numbers to make an accountant’s eyes glaze over. Many CTC participants have submitted their elevation gain numbers for the various double centuries in the series, and all of the entries are broken out by brand of computer. It makes for some interesting reading. (If you’re not into these sorts of numbers, you won’t go there; if you are into it, you’ll have fun with it.) I was just barely interested enough to skim through it and sample a few tidbits. My quick conclusion is that the Cateye is indeed prone to reading at the high end of the spectrum and the Avocet is almost always at the bottom.
It does not follow logically that just because one is at the high end of the spread of data points and the other is at the low end that both are inaccurate. Unless we have an infallibly accurate baseline against which we can measure them, we can’t know. The Cateye could be correct and all the other units too low. However, given that the middle ground of the sampling is occupied by a host of more modern and more sophisticated GPS units, we might feel safe in coming to a conclusion that the right numbers are somewhere in that mid-range.
I will just say one more thing about my Cateye before moving on: I have been using it non-stop now for over ten years...getting on to nearly 100,000 miles...and it has never had a problem (knock wood) so far. Aside from fairly infrequent battery changes, it keeps right on doing what it’s supposed to do. Compared with the Avocet, which I replaced three times under warranty in a very short period, it has been blessedly reliable and trouble-free.
Now then, on to the topic I really want to cover this month: elevation profiles.
Everyone knows what those are, right? They’re the graphic depictions of the ups and downs of our rides, with the miles along the horizontal axis and the elevation on the vertical. Rise and run. What could be simpler? Most of us, when approaching a road or a ride for the first time, like some preview of what lies ahead, at least if it’s a big ride and we know it contains big hills. So we consult the profile that has been provided by the event organizer or the tour guide or is in the guidebook we’re reading. In theory, this graphic depiction will show us, at a glance, just what we have to look forward to over the course of the stage, and it will do so within a framework that is consistent and simple.
But there’s a problem with this: there is not, as far as I know, any standardized aspect ratio for all elevation profiles. Those who create them do them whichever way they please. This means that the relative relationship between rise and run is never consistent, so any meaningful comparison between the profile you’re looking at today and another one (or dozens) you may have studied in the past is impossible.
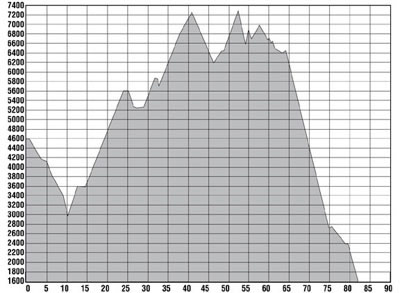
The reason why there is a need for a standardized aspect ratio is because all elevation profiles are exaggerated to some extent: compressed horizontally, or stretched vertically, if you prefer. To illustrate why profiles are distorted, I’m including two figures with this essay. Both are profiles for the same stage. It’s an 82-mile ride in Kings Canyon and Sequoia National Parks, up in the Sierra. It’s an epic ride with monster ups and downs. Starting in Cedar Grove in Kings Canyon, it descends to the lowest point in the canyon, which is to say the lowest point in the deepest canyon in the United States. Then it climbs all the way up and out of that hole and humps up and down along the spine of the mountains before descending along the Generals Highway, down, down, and down into the canyon of the Kaweah River...not as deep as Kings Canyon but still deeper, by some reckoning, than the Grand Canyon. The final 20 miles are an almost uninterrupted descent, losing a whopping 5400’ along an exceedingly twisty route. In addition to the obvious attraction of the simple gravity candy, it is also as beautiful and spectacular as one would expect a road to be in a national park. It is, quite simply, one of the most amazing and entertaining rides a cyclist could ever do...the equal of anything in the Alps or Dolomites.
![]()
I chose it for this illustration because one would be hard-pressed to find another elevation profile with such extremes of altitude change is such a short distance. Looking at the profile in the first figure, you ought to be suitably impressed by the scale of the stage. It is epic, and the profile reflects that.
Now look at the second figure. That’s the same profile without any vertical exaggeration. Not only is it unimpressive, it is also almost entirely devoid of any useful information. Let’s face it: no matter how steep and huge we think our big hills are, they really don’t look like much in real-world rise and run. So we exaggerate the scale in order to make the graphic visually compelling and useful.
The question is: how much exaggeration is appropriate? This is where I cannot find any accepted standards out there. I created these profiles. I create hundreds of them for the tours I lead. I plot mine on a grid with five miles of run to 400’ of rise. I’ve been doing this for many years, and I can no longer recall why I picked that particular ratio. Perhaps I copied it from someone else’s profile, thinking it looked about right. It seems to work pretty well. It displays the ups and downs clearly, and for a typical stage of around 60 to 90 miles, I can fit a decent-sized profile on the bottom of a route slip on a standard sheet of paper. (The profile shown here for this grand stage is at the extreme edge of the range for its vertical dimension; profiles for more typical stages will be less than half that tall.)
It seems to me that all profiles ought to conform to some standardized convention for this, whether it’s my ratio or some other scale. You may think fussing about this is finicky and esoteric in the extreme...an angels-on-the-head-of-a-pin quibble. But I submit that the elevation profile, like the altimeter, is a tool that we use to better quantify and understand our world. If it is to mean anything at all, it should exist in a form where we can be confident that we are comparing apples to apples; that our frame of reference is constant across all profiles.
Granted, if the profile includes the incremental numbers for rise and run, you can do the math and figure out what the percentage of gradient is, more or less (assuming you can add up the elevation, then multiply the miles times 5280' per mile, and then do the long division to finish the equation). But the whole point of a profile is that it is a graphic depiction, which means a quick, at-a-glance reference tool. At least that’s how most cyclists will use them when checking out the map and route slip and profile they’ve been given at check-in for today’s century ride. They’re not going to do the math; hell, they don’t even have their readers on! They can’t see the fine print. They want to look at the big, towering minarets of the profile; those extravagant spikes that tell them where the big hills are in the miles ahead. And if those graphic spikes are to mean anything at all, they ought to match up with other profiles the riders have seen on other days. If not, the whole exercise is a pointless waste of time.
A case in point is a set of elevation profiles we have at our club website for many of the hilly roads in Sonoma County. These profiles were created in a collaborative effort by my pal Lou Salz, who collected the data, and Al Bloom, another scary-smart engineer, who translated the data into the profiles. These two worked out some formula for this, and the result is a wonderful resource for folks like me who care about such climbing information.
But the problem--as you will see, if you visit the site--is that they have standardized the profiles in the wrong way. That is, they have shoehorned all of them into exactly the same sized rectangle--the same height and width--regardless of the dimensions of the road being depicted. When you look at the thumbnails, it’s impossible to tell whether you’re looking at a profile for a road that’s ten miles long or two miles long. They do have colored stripes to mark off 200’ increments of elevation, and one can infer from this that a profile containing many stripes is a bigger climb than one with only one or two stripes. But that means you have to do a little calculation in your head while looking at them to extrapolate to any sort of meaningful baseline governing all the profiles. This might be easy for numbers-crunching engineers, but it’s a bother for me.
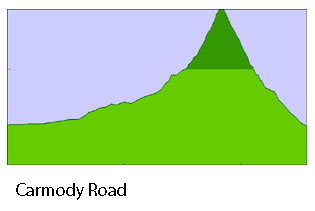
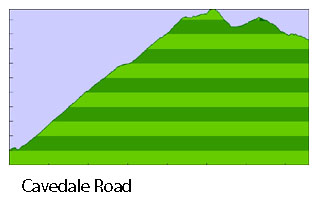
As an example, take the profiles for Carmody Road and Cavedale Road, right next to each other in the alpha sort: to look at the profiles, you would think that Carmody is a vicious, leg-breaking wall and that Cavedale is just a lazy grade. The opposite is more like it: Carmody is just an itty bitty bump and Cavedale is one of the biggest, baddest climbs in the county. All local riders know that. But what if I’m from somewhere else and contemplating a ride or two on my visit to Sonoma County? I’m looking for some of those epic SoCo climbs I’ve heard about, so I go to the site and scope out the thumbs for the profiles. My first inclination would be to head for Carmody instead of Cavedale. Yes, given enough time and enough study of the data, I would figure out that Cavedale is the bigger frog in the pond. But using the tool as a handy, at-a-glance reference? Nope. Not gonna get it.
Mind you, I am grateful to Lou and Al for going to the trouble to crank out these profiles, and I know that the information in them is about as accurate as it can be, given today’s technology. Collectively, these profiles represent a valuable resource for our region. But if I am to put these profiles to any use that makes sense for me (a visual person), I have to drag them off the website and open them in Illustrator, where I can then stretch them to fit the template of my standard profiles. They work as an archive of data, but they don’t work as graphics. And they should.
So I’m beating the drum today for the introduction of a uniform standard for elevation profiles! Call you local profile provider and demand a change. If it’s okay with you, let’s adopt my standard: five miles of run by 400’ of rise. It’s as good as any other, and if it becomes the prevailing protocol, I won’t have to go back and alter all of the hundreds of profiles I’ve already done.
Bill can be reached at srccride@sonic.net